Quantcast
Channel: #All-things-spatial
Viewing all 123 articles
Browse latest View live

Property market analysis with Thematic Mapper

$
0
0
One distinctive advantage of presenting information on maps rather than in tables is the ability to visualise geographic distribution of phenomena under investigation. In other words, choropleth (thematic) maps are a perfect tool for highlighting differences or similarities between areas, or for presenting spatial patterns.

Thematic Mapper has recently been used in the analysis of changes in median prices over time for Local Government Areas in the Sydney Greater Metropolitan Region.


The map clearly shows spatial pattern that median prices of properties located closer to the city centre grew faster than those located further away and also that the growth rate was dependant on the distance to the city centre (that is, the further away the property was located, the slower the growth was). 

This simple visualisation technique allowed drawing a conclusion that properties located close to the city centre offer the best capital return in the long term. Ultimately, it allowed resolving decisively the dilemma of every prospective property purchaser as to “where to buy”.

Read full article on Property Observer website.  

Presenting spatial data with Thematic Mapper

$
0
0
Attractive, eye catching colours and interesting graphics help to draw attention of the audience to key information presented on a map. Data presentation capabilities of Thematic Mapper are best demonstrated on the following examples:

  • Base maps– Thematic Mapper comes with a wide selection of base map layers, open source as well as commercial, to suit various presentation objectives:

  • Overlays - users are able to mix and match various overlay layers for the best visual effect and/or to enhance clarity of presented information:

  • Custom data– registered users can create fully customised choropleth (thematic) maps with standard geometry layers (eg. postcodes) and own attribute data, or any of thousands of demographic statistics (ie. Census  data) readily available for use in Thematic Mapper:


  • Point data– Thematic Mapper allows creating complex markers comprising variety of background shapes, sizes and colours, symbols (glyphs) and images; markers are interactive and can be as complex or as simple as required to convey the message:


Contact Mapdeck Team for a demonstration of Thematic Mapper capabilities with your own data.

National Map

$
0
0
A few weeks ago Australian government launched new spatial data initiative called the National Map. It is a cooperative effort of NICTA and several federal government agencies, and another attempt to catalogue, present and make accessible to the public vast amounts of spatial data created and maintained by public sector organisations.

Hopefully, this initiative will be more successful and more permanent creation than previous versions so business, as well as Australian public, can take full advantage of the investment for many years to come.


The concept of a “single online map” - the National Map, is not unique and this is not what will make this project a success. After all, there is nothing exciting anymore about “viewing things on maps” - especially within walled gardens of proprietary applications (State governments Google Globes initiatives come to mind as an example).

Rather, the value of this and, hopefully soon, State and Territory government initiatives is in exposing the data via web services for others to utilise - without constraints and within a variety of custom made applications.

Full data interoperability is the ultimate prize for the nation. Yet, this concept is so elusive and hard to achieve despite over a decade of concerted efforts of many individuals and quite a significant investment by government authorities to make it happen. Let us hope that the National Map initiative is the new beginning...


Thematic Mapper is one of many applications on the market which can readily make use of all those new data services. It is well capable of not only displaying National Map data layers but also allowing to “mash” them with a variety of other open source as well as proprietary information.

Take for example this set of maps depicting Internet availability and quality of signal in Australia. It is created with free and readily accessible Census data from the Australian Bureau of Statistics as well as information served by the Department of Communications:


You don’t have to be a GIS expert to make useful, informative and beautiful maps with Thematic Mapper. Contact mapdeck.com team to arrange a demonstration with your own data.

State postcode maps

$
0
0
Postcodes are the most widely used and accepted reference to locations across Australia. Postcodes are considered more manageable spatial unit than localities and offer more detailed breakdown than Local Government Areas and hence, are favoured for many business applications, ranging from sales area and franchise territory delineation or service delivery determination, to profiling customers and competition.

However, localising postcode extents on the ground was always a challenge since the numbering system does not follow strict conventions.

The most practical to use version of postcodes are Postal Areas created by the Australian Bureau of Statistics as they cover consistently the entire Australian continent and allow matching company data to vast amount of statistical information, including socio-demographic data from Census.

Postcode Finder, published by aus-emaps.com, is a free online reference map allowing quick lookup of the location and boundary extents of any postcode within Australia.

We are also offering the information in a pdf format, suitable for printing in up to A1 size. There are two types of postcode maps available for immediate delivery:

Capital city maps (which include suburb boundaries):

. Greater Melbourne
. Greater Sydney
. Brisbane and Gold Coast


State/Territory maps (which include population counts per postcode):

. Queensland
. New South Wales
. Victoria
. Tasmania
. Northern Territory
. South Australia
. Western Australia


Individual maps are $30 each and the full set can be purchased for just $150 (10 maps in total).

As with all our products, these maps can be customised to meet specific requirements. For further information or to purchase the set, please email us on info@aus-emaps.com

Related information:
Map of Australian Postcodes

Mapping Consumer Spend

$
0
0
Identifying locations with the greatest potential for your product or service is a challenge for any business regardless of the scale of operations.

Conducting large scale customer research can be time consuming, not to mention costly, and buying expert reports may not necessarily provide the level of detail required to identify specific locations to focus your sales efforts on.

However, there is a quick and inexpensive way to evaluate market potential and to locate the most promising places for business expansion using information from the Australian Bureau of Statistics and some clever tools. Surprisingly, these tools can yield very accurate results with very little effort.

As a demonstration, let’s consider a supplier of haircare products who intends to tap into the Sydney market. Using Mapdeck’s Thematic Mapper application it only takes a few mouse clicks to create a map with all the essential information for analysis:


[Household expenditure on haircare products by postcode]

The map clearly demonstrates that locations around Parramatta, Blacktown or Liverpool offer much bigger potential for haircare products than Sydney city and Eastern Suburbs (i.e. high concentration of dark red polygons indicating higher consumer spend).

With a few additional mouse clicks, it is easy to determine the estimated value of total haircare product sales in these 3 locations - for example, by defining a 5 km radius around the main retail precinct as a catchment area. It would yield the following result:

Estimated Market Size for Haircare Products:

Parramatta: $17.8M p.a.
Blacktown: $6.8M p.a. (excluding locations within 5km radius from Parramatta)
Liverpool: $15M p.a.

And how big is the overall market for haircare products in Australia? A few more mouse clicks are required to download the data and to open the csv file to reveal the big number:

Estimated market size for haircare products in Australia is almost $1 billion p.a. (lower bound is $950 million and upper bound is $1,035 million p.a.)

Not bad for 5 minutes work.

There are over 600 product and service categories to choose from to conduct your analysis and information can be mapped down to Statistical Area 1 (SA1) level, which means you can examine data over areas as small as just a few neighbourhoods.

Whether you are evaluating overall market potential or just investigating opportunities in specific catchment areas, the information available via Mapdeck can get you answers quickly. Ultimately, this will help save time and money so you can concentrate on exploring any identified market opportunities and not on chasing the data required to conduct the initial analysis.

For more information on this and other cost effective market intelligence solutions for business of all sizes please contact us via enquiry form on mapdeck.comsite.


Related Posts:
How maps can improve sales

MapDeck Crowdfunding

$
0
0

We were overwhelmed with the interest in MapDeck and our applications so this offer has now closed.  You can still register your interest in beta release via contact form on mapdeck.com site. Stay tuned for the updates!


Please review the details of the offer below and submit your expression of interest via the contact form on Mapdeck.com front page. 

[ Our mission ] 

We believe that good information empowers businesses to make better decisions. And in turn, better decisions allow your organisation to reach its goals faster. Hence, access to the right information is imperative to your businesses future success.

By facilitating easy access to useful data and analytical tools - anywhere, at any time, and on any device – we can provide our users with a unique advantage: an opportunity to consult and review crucial information at the time of making important decisions. With MapDeck you can make fully informed decisions at any time.

We are currently building the infrastructure to make this all possible. By taking advantage right now of our first two stand-alone web applications you can help us with its development and bring forward the official launch of MapDeck to mid-2015!


[ Who will benefit from this offer ]

Our first prototype apps will be of particular interest to those who:
  • create and manage sales territories, franchise territories, or dealership areas based on postcodes; 
  • require socio-economic statistics to identify market opportunities in specific locations.
You will find links to examples of the output that can be created and published through our MapDeck applications below.


[The offer] 

We are inviting 100 new users to subscribe to our Mapdeck data and application package at a highly discounted price.

The apps are stand-alone, fully functional prototypes, a bit rough around the edges but already delivering real benefits to many existing users.

You do not have to wait for the Mapdeck platform to be fully operational to start reaping the rewards of incorporating spatial information and analysis into your decision making processes.

Start your subscription now by submitting your expression of interest via the contact form on Mapdeck.com front page


The package offer includes:

Sales Area Management Tool: this tool facilitates the fast creation of sales or franchise territories based on manually selected postcodes - either via a map-click function, drawing a circle or polygon on a map, or by typing in the required postcode numbers.


It takes only a few minutes to chart these territories, rather than weeks of painstakingly matching individual postcode numbers to locations off hardcopy maps. Information can then be exported in CSV format for reuse in spreadsheets or saved for editing at a later date.

For further details about Sales Area Management Tools functionality please refer to this All-Things-Spatial blog article.

Thematic Mapper: this tool allows you to create a visualisation of location-specific information that is matched to administrative boundaries (such as postcodes), or alternatively, to location-points (such as cities, towns or individual addresses).

Unlike other online GIS tools, Thematic Mapper allows you to create choropleth (thematic) maps on-the-go. In other words, polygons are assigned colours dynamically, according to rules defined by the user, and maps are not preconfigured in advance by the system administrator.

This capability empowers users to create custom maps, according to individual requirements and aesthetics - regardless of whether the map content is based on generic data (for example, postcode boundaries and Census statistics) or based on user private information* uploaded to the server (for example, monthly sales by postcode or by individual customer).

/*Please note, this specific functionality is not yet fully automated and hence it is not part of the package offering. However, we will be very happy to assist you with importing your own data under a separate arrangement./ 

The key advantage of Thematic Mapper is the ease in creating and publishing maps online. Users do not have to source their own data or be experts in GIS or spatial analytics to create comprehensive, information-rich and visually attractive online maps.

For further details about Thematic Mapper’s functionality please refer to this All-Things-Spatial blog article

Data included in this deal:

  • 2011 Australian Postal Area boundaries (2,500+ polygons) 
  • Census 2011 Basic Community Profiles (over 7,000 individual data items) 
  • Background maps and imagery from various open source projects (including OpenStreetMap and Geoscience Australia) 
  • location search powered by MapQuest’s Nominatim service 

Would you like to have access to similar information for the US, or UK or New Zealand? Be the first to ask! 

[ Consideration ] 

For a single payment of A$... [offer no longer available] you will secure a 12 month subscription to the above listed tools and data (tax invoice provided). This represents a significant discount to other, less-powerful GIS tools currently available in the market.

PLUS, all subscribers will receive:
  • free access to equivalent Mapdeck tools and data when it is formally launched (excluding the public publishing option) for the reminder of the subscription term; and 
  • 50% discount on the first full year subscription for these two Mapdeck tools if you choose to continue with the service. 

Please use our contact form on mapdeck.com to register your expression of interest in this offer.

Important! Please note: The tools and data under this offer are provided on “as is” basis, with no warranty as to their fitness for any purpose or that your access to the service will be uninterrupted or error-free, also that any defects will be corrected. These are, after all, only prototypes.

The tools in the prototype release are intended primarily for individual use and the map sharing functionality is suitable only for small groups of users. While we place no restrictions on how many maps can be created and published per account, this offer is conditional on the overall traffic to all accounts not exceeding 100,000 users a month.

In the interest of all subscribers to this offer and their patrons, we reserve the right to block any maps that account for unreasonably large proportion of the traffic. The decision will be at our sole discretion. If you think traffic to your published maps will exceed the limits we will be happy to discuss contingencies on case by case basis.


[ Other options to participate in this initiative ] 

If you are not in a position to assist financially in the development of the Mapdeck platform by taking up our offer, you can still provide us with valuable feedback on the public maps created with the Thematic Mapper app. All it takes is a short message using the “contact us” form on mapdeck.com!

Any comments on what you like or don’t like about the functionality of our apps, suggestions on how to improve them, or any request to add other functionality, or even build entire application are most welcome!


[ Examples of Thematic Mapper public maps ] 

Created with standard information:
Census data for property buyers


Created with custom information:
Demonstration of Thematic Mapper functionality (public maps)
Sydney Greater Metropolitan Region Property Prices
[In]Sight Regional Competitiveness Index for Local Government Areas 
Southern Inland - Local Business
Southern Inland – Employment
Southern Inland – Population
My Broadband maps 

Test run: mapping 350,000 vector polygons

$
0
0
We are currently testing our new spatial data server. The challenge was to display around 350,000 Mesh Block polygons - in real time, in a standard browser without WebGL support. Why? Not just because... The future of online GIS is in real time rendering of spatial information - according to individual user requirements and attribute information that may be changing every second, on desktop as well as in mobile devices. This milestone takes us closer to having technology with such capabilities.


Briefly about Mesh Blocks - they are the smallest geographic region in the Australian Statistical Geography Standard (ASGS), and the smallest geographical unit for which Census data are available.

They broadly identify land use such as residential, commercial, educational, agricultural and parks, and contain counts of the total usual resident population and total dwelling count from the 2011 Census of Population and Housing.

This is the largest polygon file for Australia we could get our hands on so far (the data is distributed by the Australian Bureau of Statistics in several files – one for each State or Territory, but we combined them into a single file). The next test is to handle and display all cadastre boundaries…

Census 2010 data for California ZIP codes

$
0
0
We are busily collecting spatial data for our soon to be launched MapDeck.com platform. Below is a sample of the US 2010 Census data for California ZIP Codes (5-Digit ZIP Code Tabulation Area or ZCTA5 to be precise) presented as a series of choropleth maps using a prototype version of our Thematic Mapper app.


To explore the data follow this link: California Population Statistics by ZIP Code (2010)

Improving property selection with Census data

$
0
0
First published on PropertyObserver.com.au

Buying a property is a complex process with many decision points along the way, regardless of whether you are buying to live in or to rent out. A very important part of that decision process is deciding where to buy, and what type of property in particular.

There will be those rare occasions when the buyer just sees a property for the first time, either in real life or just on a picture, and immediately knows “this is it!”.

However, more often than not, the selection of a property for purchase is an elimination process whereby you firstly exclude what you don’t want, and then evaluate and rank what is left to arrive at the final decision.

In either case, the more time one spends learning about various property options and getting to know the peculiarities of the local market, the better the chance of spotting that ‘perfect opportunity’ - or at least making the selection process a more logical exercise, and hence less stressful.

There is a large variety of property market information available to individuals. Some information is accessible for free online as part of marketing activities of various real estate related web sites, while other requires payment of hefty fees to access.


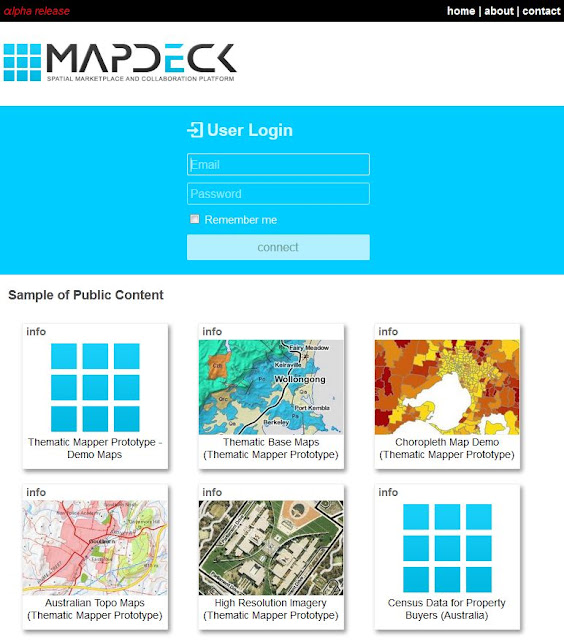
Although Australian Census data may not be at the top of the list of the most popular information sources to consult when buying a property, it is a great resource that should be seriously considered as a starting point in the purchasing process.

The key advantage of using Census data in property market research is that it allows you to quickly narrow the choice of locations to concentrate your further, more-detailed research on. Hence, it allows prospective buyers to make their research more focused, and subsequently, a much cheaper and much faster exercise.

After all, as any real estate agent will tell you, buying a property is about ‘location, location, location’. So, defining ‘where’ to start looking should always be a priority.

Sales reports for suburbs or postcodes that list recent transactions provide prospective buyers with good insights into the price distribution in a given location and at a given time but can be quite expensive to obtain. These are great for the final stage of your research when you are comparing between specific offerings on the market and assessing whether what you are interested in is good value in relation to other recent sales in that location.

However, considering there are a few hundred suburbs or postcodes per capital city, accessing all that information would be prohibitively expensive. Not to mention impractical if it is delivered in a pdf report format.

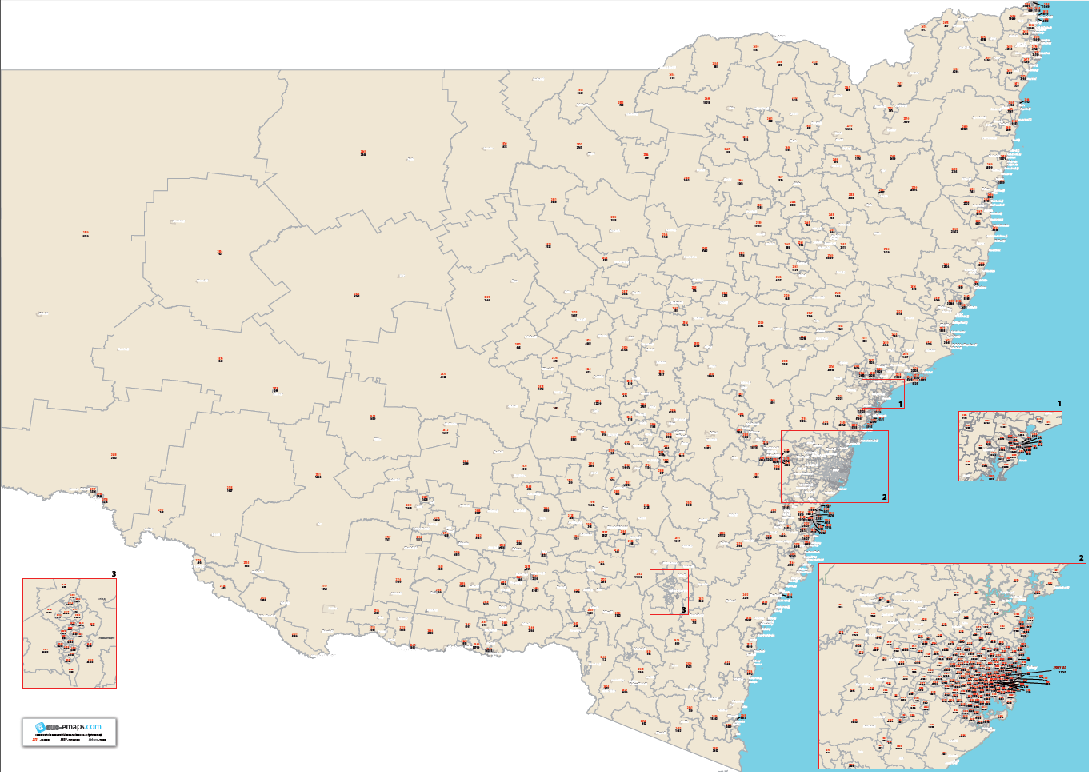
Therefore, tools that allow analysing and mapping data across whole regions offer much more utility in the early stages of the research.

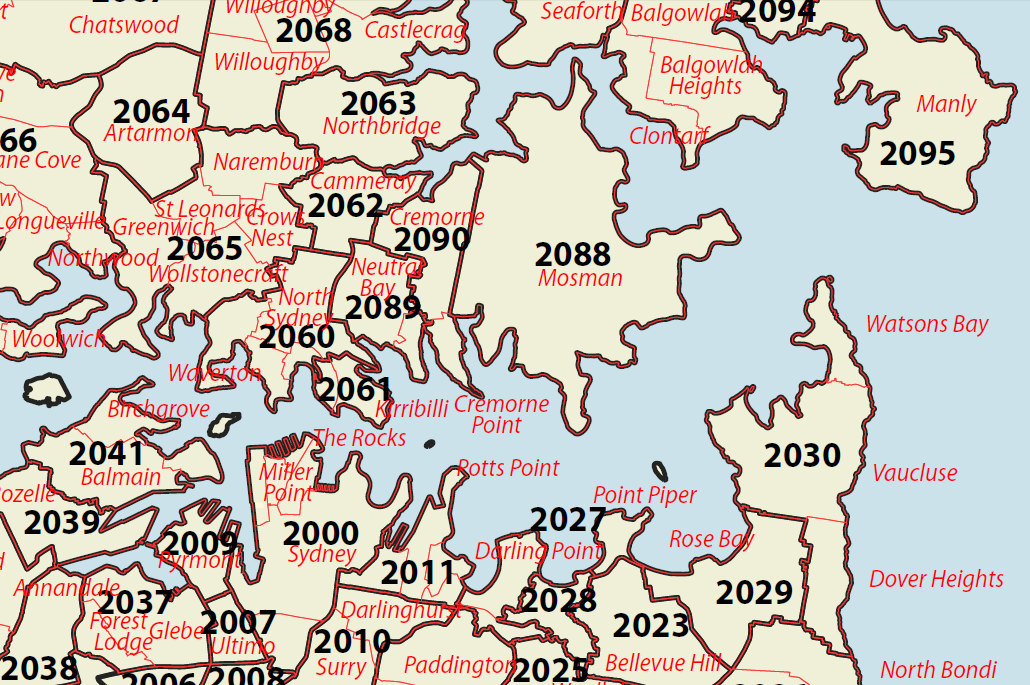
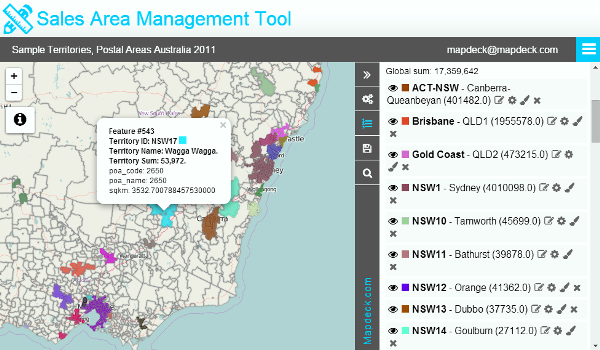
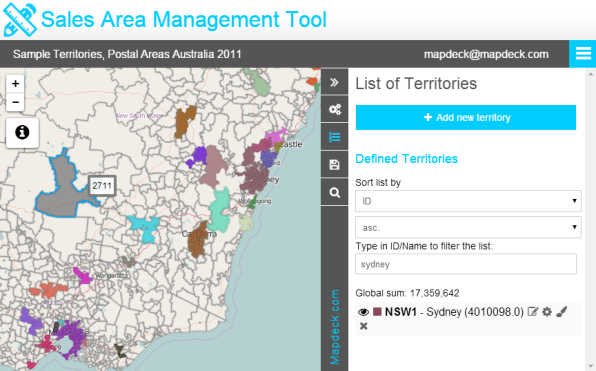
Let’s review a few examples of simple maps with data from the latest 2011 Census of Population and Housing to illustrate the value of such information for deciding on where and what to buy. We will focus on Sydney and will use postal areas as a geographic reference.

Census data was current as at 6 August 2011 so it may appear a bit dated in 2015. However, in this analysis we are primarily interested in the relative differences between areas rather than absolute values, therefore the age of data is not so important, as long as it is reasonably recent.

The obvious choice in starting the analysis would be to look at median mortgage payments per postcode – this acts as a quick reference to the distribution of prices across the city. The map below gives a good indication where the expensive and not so expensive parts of Sydney are.


However, using this dataset alone will not allow you to distinguish between areas with lots of new mortgages (hence high mortgage payments) and those with expensive but mostly paid-off properties (that is, with smaller remaining mortgages).

Therefore, median rent data provides a much more useful picture since rental costs and the cost of buying a property are closely related (see “Australian property prices explained” for the explanation of this concept).


Using the map like the one above, you can determine areas around the city with similar property prices. For example, if you have identified one area with properties in your price range, by locating polygons shaded in the same colour you can easily identify neighbourhoods that have similarly affordable properties.

Price affordability is one factor affecting the choice of location but how desirable is the neighbourhood is another important consideration in the purchase decision. You could try to assess the attractiveness of the neighbourhood based on the rate of unemployment or family incomes but the best summary measure is The Index of Relative Socio-economic Advantage and Disadvantage which summarises information about the economic and social conditions of people and households within an area.

For example, a low score indicates relatively greater disadvantage and a lack of advantage in general. That is, these are locations with many households with low incomes, or many people in unskilled occupations and few households with high incomes, or few people in skilled occupations.


It is all well and good to follow advice to “buy in the West” because it is cheaper and prices have the potential to rise more than in the East over the next few years (this pattern of price growth was explained in an earlier article “Inner ring the best bet in Sydney and here's why”) but the decision has to be balanced with the risk that it will be much harder to sell or rent out in those locations when the going gets tougher.


Furthermore, as an investor, you may be interested primarily in locations with high concentration of rental properties which indicate high demand for rental accommodation. Whereas, owner-occupiers may prefer to avoid areas with excessive stock of rental accommodation.


Landlords cannot and should not discriminate against families with young children but those who would like to reduce the risk of excessive wear and tear of their rental properties could use Census data to pick locations where probability of this type of tenant is reduced.


And how crucial is a parking space if you are buying an apartment to rent out? Sure, it is great if there is one included in the purchase price but for many locations along major train lines and arterial roads where 30% or even 50% of households do not have a car, lack of parking space should not be a deal breaker.


Finally, consulting Census data can also help prospective buyers as well as existing landlords to assess the potential of specific locations for group rentals which can significantly boost rental yields by maximising income from the asset.


Census data cannot provide all the answers but it is of great help in the property selection process as it offers a fast way to narrow your search options to a handful of locations to then focus your more detailed research on. Using Census statistics will save you money and valuable time in arriving at the optimal selection for purchase.


Mapdeck in alpha release

$
0
0
We have a small announcement to make today – mapdeck.com platform is now officially in alpha release. No time for confetti and big celebration yet as we are busily testing core functionality with a selected few to iron out any bugs and workflow issues.

The task is not easy when you consider we are building our own mini versions of Dropbox and Google Docs, and at the same time, reinvent basics of GIS concepts and technology while defining new spatial cataloguing standard…   Not a small challenge for a team of just a few.

We took the opportunity to tidy up mapdeck.com front page and present you today with new site design and logo:


Front page now has links to a few demo maps created with Thematic Mapper app– this is still only an older prototype version but is powerful enough to be deployed in full production capacity and many of our clients are already taking advantage of its capabilities.

More exciting news coming soon!

Mapdeck beta testing invitation

$
0
0
We are very close to finalising Mapdeck.com functionality for the beta release and are looking for testers!

GIS background not required since Mapdeck service is aimed at people with no or limited experience with spatial software. Please send your expression of interest to participate via email to info@aus-emaps.com or via contact form on Mapdeck.com web site. All testers will have priority when applying for affiliates/reseller status (i.e. Mapdeck.com revenue sharing program).

Mapdeck.com platform turned out to be quite a complex beast, with many independent modules which require integration within the main platform to enable full interoperability. Although the core functionality in the initial release is limited, it will enable individuals to:


  • sign up (i.e. create free account)
  • upload own files (spatial and non-spatial)
  • subscribe to a selection of spatial data and apps (free-of-charge and time limited paid subscriptions)
  • create and manage user content (with compulsory metadata for ease of managing information resources)
  • upgrade subscriptions to enable sharing – user content as well as Mapdeck apps and data 
  • create teams and share selected content; and
  • request assistance via User Support 


There are several functional components of Mapdeck that we would like to test in particular:

  • Mapdeck Vault: free app for managing and sharing user content
  • Mapdeck Finder: new spatial resources catalogue app with data, apps and user content search functionality 
  • Subscriptions and purchase workflow: for adding data and applications to user account
  • Free system apps: Data Viewer, Data Editor, File Manager and Deck Creator
  • First lot of specialised apps: Sales Area Management Tool v2 and Thematic Mapper v2 (when ready)

As you can see, there are many moving parts in Mapdeck and we would like to ensure everything is working as expected before we throw the gates open to the public. Your assistance will be greatly appreciated!


Related Posts:


Update on the status of All-Things-Spatial

$
0
0
It has been a quiet year on All-Things-Spatial. We have only managed to publish 6 posts so far. The main reason for the lack of updates is a very busy schedule on the development front, with all hands on deck (pun intended!) to bring MapDeck concept to fruition. And to the point that it can be successfully launched on the market!


The project turned out to be much bigger than anyone anticipated but now the platform is very close to the official release. Thanks for all the financial support and great feedback we received during testing of various concepts! MapDeck users will be the ultimate winners – with easy access to tons of free and cheap data and tools.

We believe MapDeck is something very, very special – but you have to experience it in person to fully appreciate the potential. MapDeck may not be the prettiest website on the Internet, and may not have all the bells and whistles (yet!) of more mature (and better funded!) cloud based mapping software available on the market but it is the only one that offers fully personalised experience.

MapDeck will be launched with only a basic set of tools and information but product range will expand over time to meet a growing list of user requirements. More on what is available in a separate post. For now, we would just like to bring you up to date on the administrative arrangements for moving forward with this project.

In particular, MapDeck is a global service provider and operates as an independent business.


At the same time, aus-emaps.combrand will continue to participate on the project as a lead partner in Australia, providing local content for the platform as well as servicing local clients.

All-Things-Spatial blogwill remain under aus-emaps.com control. It will be a vehicle for promoting MapDeck capabilities and for educating current and prospective users of the platform about advantage of using spatial technologies for decision making purposes.  

We hope you can join us here regularly for insights and good ideas how to make the most of MapDeck functionality. Stay tuned!

Sales Area Management Tool 2015 upgrade

$
0
0
As MapDeck is getting readied for the official, albeit soft launch in December 2015 we would like to start introducing individual apps that will provide initial functionality of the platform.

Sales Area Management Tools (SAMT) is the first app we would like to bring to your attention. Initially developed as a stand-alone proof of concept, SAMT is now fully integrated with MapDeck platform. It means, output can now be saved in the cloud and can be shared with nominated individuals. And SAMT is now accessible on any screen size (i.e. desktop, tablets and on mobile phones).


Sales Area Management Tool: mobile screen view

SAMT functionality was significantly expanded. For example, users can now select any polygon structures to build their territories with, including postal areas/ zip codes, suburbs and other administrative boundaries available in MapDeck catalogue.

These boundaries can be joined with attribute information, like counts of persons or estimates of market value, so when polygons are joined into territories overall totals for individual territories are calculated automatically. It will help in creating balanced territories and with rebalancing territories as local market conditions change over time.

Sales Area Management Tool: territories with attributes (desktop view)


Map window now extends to a full screen and users have much more control over styling of individual territories. There is an option to change base map background to any map layer available in MapDeck catalogue. As well, users have the ability to display only one territory at a time (e.g. for printing purposes).

For ease of use, polygon names appear on-mouse-over and location search is now a standard functionality of SAMT. Sorting by name or id, and searching within long lists of territories, is also supported.

Sales Area Management Tool: filter by territory name and mouse-over functions (desktop view)

Users have the ability to create several versions of territories and saving them all in the same data table.

However, the most significant innovation added to SAMT is the ability to include a trace-over layer on the map. This functionality can be very handy for displaying older versions of territories in the background when creating an updated or alternative version. Or in case where territories have to be reconstructed from a different geography.

For example, territories created from postal areas could be easily recreated with suburbs when the former is used for reference as a trace-over layer.

Sales Area Management Tool: recreating postcode based territory (orange) with suburbs (purple)

The latest version of Sales Area Management Tool can be accessed right now by current users of version 1 of the app. Please contact MapDeck’s Australian affiliate aus-emaps.com via email on info@aus-emaps.comto arrange for login details.

Overview of MapDeck support for common map layer services

$
0
0
MapDeck mission is to personalise location intelligence services. That is, to deliver tailored solutions to meet specific requirements of a wide range of users - from private individuals and small business operators, to professionals and persons in corporate roles.

Flexibility in selection and ease of mixing map layers is a basic requirement for personalising map creation process. It is especially important for those users who are just starting to master the power of maps for decision making and who are not yet technically savvy to use advanced features of spatial software.

Unfortunately, the reality is that even a simple task, such as displaying several map layers from different web services, can turn into quite a challenge because of incompatibilities of variants of public web map services available on the Internet.

MapDeck’s Map Layers Manager handles that complexity of options, which makes it easy for anybody to work with almost any map layer, regardless of web service origin.

"[It] handles information published in Open Street Map (OSM), Tile Map Service (TMS), Web Map Tile Service (WMTS), Web Map Service (WMS) as well as ESRI image, map and tile service formats..."

Map Layers Manager tool handles information published in Open Street Map (OSM) tile format, but also those in Tile Map Service (TMS), Web Map Tile Service (WMTS), Web Map Service (WMS) as well as ESRI image, map and tile service formats. Also those variants requiring access key and/or published with custom parameters. That should cover 99% of map service formats available on the Internet.

MapDeck users have an option to subscribe to Map Layers Manager app which will give them the ability to create their own map layers from almost any web map service publicly available on the Internet. These custom map layers can then be used to create personalised maps and/or can be shared with other MapDeck users.

But perhaps of the most interest to all is that, thanks to Map Layers Manager, many public, as well as commercial, web services will be catalogued and pre-configured for immediate use with MapDeck apps, making it very easy to discover and mash map layers, and ultimately to customise map content to individual requirements.

MapDeck.com public page

The first batch of 32 public map layers has already been published on MapDeck beta test version. Additional 220+ map layer services have already been preconfigured and they will be progressively released to MapDeck users.

Sales Area Management Tool makes tedious tasks easy - and fast!

$
0
0
Marking franchise territories, sales areas or delivery zones can be quite a challenge if you are not using advanced GIS software.

This is especially the case if you have to factor in the distance (for example, from a local office or retail premises or your warehouse), or account for some local market characteristics (like potential market size), in order to balance workloads of your staff, or optimise for available resources or profit potential.

Sales Area Management Tool (SAMT) is a simple, inexpensive online mapping application, but packed with features that will make the job very easy. And fast! So you can focus on chasing business opportunities and not on tedious tasks of collecting hardcopy maps, then hand drawing territories and compiling information into spreadsheets, which could take weeks...

The following use cases highlight several advanced features of SAMT and demonstrate the power of this application as a business tool, indispensable for making informed decisions, with minimum effort. 

Use Case 1: Generating franchise territories with predefined number of prospects
A very convenient feature of SAMT is that it enables linking polygons with attribute information about those polygons. For example, with data from Census, like the number of persons or dwellings per postal area or zip code. Totals for individual territories are calculated automatically as polygons are selected so, it is easy to experiment with different compositions of polygons per territory.

Example of balanced territories defined with Sales Area Management Tool (variable: total population)
If you have good understanding of your target market and are able to define minimum size to sustain individual franchisees, you will be able to mark territories with high precision, optimising the total number available for sale. In other words, you will be able to maximise your profits.


Use Case 2: Defining sales areas of equal market size in key destinations
Another very convenient feature of SAMT is the ability to display a trace-over layer, in addition to the main geometry layer used for creation of sales territories.

For example, a dataset outlining extents of the largest cities could be displayed on the map as a trace-over layer to highlight locations to concentrate on. Polygons of suburbs overlapping with these reference locations could then be used to create a set of sales territories.

And if those polygons are attributed with market size information (e.g. population counts, as in the previous use case, or $ market size estimates based on Household Expenditure Survey data), it will be possible to create territories with equal potential.

Example of using trace-over layer when marking primary territories

Given current sales resources, organisations can maximise profit opportunities by focusing on the largest and the most accessible geographic markets. And having a fair estimate of the potential in each target area will help with setting reasonable expectations about anticipated revenue but also with managing workloads of sales staff and measuring their relative performance objectively.


Use Case 3: Marking delivery zones
“Select by circle” functionality of SAMT allows drawing on the map a circle with a defined radius form a predefined point. This functionality makes it easy to define delivery zones by selecting polygons within the specified distance from a location of interest. And since polygons selected and compiled into zones by smaller radius circles are not included in the circles with a bigger radius, it is a very easy to define secondary and subsequent delivery zones. 

A list of polygons included in the selection (i.e. defined delivery zones) can be downloaded in csv format and converted into look-up tables for sales staff to, for example, calculate appropriate delivery charges when filling orders from customers. 

Example of defining delivery zones from postcodes: 5km, 15km and 30km radius 


These three use cases demonstrate how simple, spatially enabled apps can help in day to day operations of business of any size. Why would anyone spend days, or sometimes weeks, and very often many thousands of dollars, trying to accomplish what can be done with SAMT in a matter of minutes?

Even very small, incremental improvements in efficiency of your operations, or a decision that allows better optimising profit opportunity, can make a huge difference over time - so you can reach your goals faster and shorten the path to success.

MapDeck is still in locked beta-test release phase but subscribers to stand-alone SAMT v1 app can take advantage of free access to MapDeck tools and data at no additional cost. Contact aus-emaps.com on info@aus-emaps.com for more information.


Related Posts:
Sales Area Management Tool 2015 Upgrade

Mapping territories for multi-category franchise

$
0
0
The majority of franchise brands focus only on a single line of business so, mapping territories of their operations is a straightforward task. However, there are operators, especially in the service industries, that offer franchises across multiple categories. 

Mapping territories for each category and keeping track of their status, for example from the initial expression of interest stage through to finalisation of the sale, is an order of magnitude more difficult. 

Sales Area Management Tool offers a simple solution to this problem. In particular, the functionality that enables recording different versions of territories in a single file, for example for modelling different composition or keeping track of extents  of territories as they evolve over time, can also be utilised for managing multi-category franchise operations. So, rather than naming individual territory sets as v1, v2, etc. they could be saved as “Service A”, “Service B”, etc.

Example of mapping multi-category franchise using trace-over layer functionality
SAMT allows displaying and editing only one territory set at a time. However, by utilising trace-over layer functionality, it is possible to display another set in the background. And switching between different territory sets is then only a matter of two mouse clicks.

The advantage of maintaining all the information in a single table is that it makes it easier to reconcile the information between all internal systems, like accounting, sales, marketing, and/or business intelligence.

Contact aus-emaps.com on info@aus-emaps.com for more information or a demonstration.

Related Posts:
Sales Area Management Tool 2015 Upgrade
Sales Area Management Tool makes tedious tasks easy - and fast!

Small area statistical geography for better insights

$
0
0
A guest post explaining advantages of using small area statistical geography over more recognisable but less revealing administrative boundaries. 

Why SA1's beat Suburbs

At Microburbs, we want to quickly and comprehensively explain an area to people, and connect people with areas to live in that match their needs. The real estate industry, however, is stuck on the idea of suburbs. Australian suburbs can be extremely diverse, and the experience of living at one end or the other can be very different. Suburbs are simply too diverse and not precise enough to describe the environment and the lifestyle.

The solution, for us, is the ABS Statistical Area 1, or SA1. These handy non-overlapping areas are subdivisions of suburbs, each with around 400 people and usually bordered sensibly by roads, rail and rivers etc.

Technically, there are 8,500 suburbs in Australia, 4,842 of which have more than one SA1 in them. This might make it seem like SA1's and suburbs are equivalent much of the time, but just about any suburb you’ve heard of is populous enough to contain multiple SA1's. The other 4-odd thousand of them are mostly rural areas.

SA1's for Income

The average difference between the richest and poorest SA1s in a suburb (income) is a huge $466 per week in pre-tax personal income.

Here we’re not talking about inequality between people, but between neighbourhoods. For an average suburb, the highest earning community, on average, brings home $24K per year more than the lowest earning end of town.

Corio, north of Geelong and south of Avalon Airport, has the highest difference. There the residents of the poorest SA1 earn an average $425 per week, while the richest earn $2142. The 5-fold difference! The extremely remote Wiluna in Central Western Australia comes next. Unsurprisingly, inner city suburbs are well represented in the top 20 too.

But typical suburban places have large differences too. Your average suburb has 38% difference in income between the richest and poorest SA1. Suburbs containing SA1's close in income are rare. Only 10% have average SA1 income differences within 10% income of each other.

Let’s look at a couple of suburbs.

Median Income By Neighbourhood - Bondi NSW: $1,118 (red) to $2,577 (green) per week

Median Income by Neighbourhood - Fortitude Valley QLD: $760 (red) to $2,454 (green) per week


SA1's for Age

Age is also a characterising factor for SA1s. Although the average SA1 has 26% of residents 55 or over, most suburbs have very uneven distribution of over 55's among SA1's, and suburbs that are statistically 'young' often have older SA1's within them. Like with income and public housing, we are avoiding suburbs with SA1's composed entirely of large retirement villages.

Proportions of population over 55 years of age - Hunters Hill, NSW: 71% (red) to 1% (green)


SA1's in Practice

As a practical example, let's try to get some insight into the relationship between the amount of residents over 55 and weekly average income. We'll look at the City of Randwick in Sydney, having 7 suburbs and 150 SA1's.

First, the scatter for each suburb in the City of Randwick

We could characterise Randwick the suburb as generally younger and wealthier, Kingsford as younger and poorer, and the other suburbs as older, and similar in income. To get a real insight though, let's explode that to each SA1 in the City of Randwick.


With the benefit of SA1 breakdown, we can see that it's not just Kingsford, but also Randwick and Matraville that contain low income younger populations, and that Little Bay and South Coogee also have areas of high income earning young people. If we wanted to study young, low income areas, we would be much better served by the SA1's in the bottom left cluster than studying all of Kingsford, which has several older clusters too.

There's some key examples to illustrate why characterising areas at a suburb level is simply too broad to be effective, when we have such a good alternative in SA1's. They're free to download in your preferred format from ABS in MapInfo or Shapefile format, and easy to integrate into your next project. Hopefully you'll find breaking your dataset down to the SA1, or microburb, level as useful as we have.

15 complex tasks Sales Area Management Tool will make easy

$
0
0
Sales Area Management Tool (SAMT) is very versatile in terms of possible applications.

At the core of SAMT functionality there is a very simple mapping widget that enables manual selection of polygons and compilation of those polygons into user defined groups. However, the overall capability of SAMT can be utilised in many creative ways.

One of many potential uses of the tool: defining delivery zones


SAMT is one of the first advanced productivity improvement tools released on MapDeck platform. We have unveiled the latest version about a month ago and since then we have promoted its virtues in several posts. Today we present an extended list of potential uses for SAMT: 
  1. defining sales areas, franchise or dealership territories based on common administrative boundaries, like postal areas/ zip codes or suburbs;
  2. generating images of individual territories for inclusion in contracts for sale of franchises or other reports;
  3. testing territory composition or rebalancing existing territories based on polygon attribute information, such as number of clients, potential market size or actual revenue form a given location;
  4. creating simple lists of postcodes/ zip codes, suburbs, etc. administrative areas that fall in X km radius from a given location;
  5. creating lists of polygons (e.g. suburbs) contained in a larger administrative area (e.g. Greater Sydney);
  6. defining catchment areas for retail operations bases on distance from the location;
  7. defining catchment areas based on the distribution of clients in the surrounding postcodes or suburbs;
  8. defining delivery zones based on the distance from a location;
  9. defining delivery zones for different days of the week;
  10. creating maps outlining work areas for market research staff  or charity donations collectors;
  11. creating simple thematic maps for documents and reports, (e.g. based on sales and revenue, or visitor statistics that can be matched to postcodes/ zip codes or suburbs);
  12. highlighting geographic extents of interest for regional organisations (e.g. based on LGA boundaries);
  13. recreating land planning zones based on Census mesh blocks and information from local authorities;
  14. visualising TV and radio broadcasting reach for local advertising campaign purposes;
  15. defining localities affected by natural disasters (like storms, bushfires, floods) and highlighting the severity levels;

When explaining benefits of a product it is always a good idea to present real life examples to illustrate how users are actually gaining advantage by utilising available functionality. However, we value privacy of our clients and will never disclose who is using various tools on MapDeck platform, and for what purposes, as this may reveal certain operational advantages to their competitors. Therefore, we will only present generic use cases when demonstrating where MapDeck tools and data could be potentially utilised.

Education of current and future MapDeck users about the benefits of location intelligence is an important part of our mission so everybody who registers on MapDeck is well informed how to make the most of what is available – with the least effort and at the lowest cost.

Contact aus-emaps.com on info@aus-emaps.com for access code to test SAMT with your use case scenario.

Related Posts:
Sales Area Management Tool 2015 Upgrade
Sales Area Management Tool makes tedious tasks easy - and fast!

Mapping territories for multi-category franchise 

Creating thematic maps with Sales Area Management Tool

$
0
0
As hinted in one of our earlier posts, Sales Area Management Tool (SAMT) can be used in many creative ways. In this article we demonstrate its use as a simple thematic mapper app.

Firstly, a brief overview of what thematic maps are and what they are used for.

Very often it is desirable to review the information available on hand in a summary format, for example to highlight the main patterns or trends otherwise buried in the details. One simple technique when dealing with spatially distributed phenomena is thematic mapping (or, as it is technically known, choropleth mapping). Wikipedia provides a comprehensive definition:

A choropleth map (from Greek χώρο ("area/region") + πλήθος ("multitude") is a thematic map in which areas are shaded or patterned in proportion to the measurement of the statistical variable being displayed on the map, such as population density or per-capita income.

The choropleth map provides an easy way to visualize how a measurement varies across a geographic area or it shows the level of variability within a region.

To create thematic map you will need:
  1. spatial data representing areas as polygons (e.g. postal areas or zip codes)
  2. attribute information about those polygons (e.g. Census statistics)
  3. mapping software to create a map (e.g. Sales Area Management Tool)
  
If you already have a summary dataset (e.g. information on family incomes from Census or similar source) which can be referenced to a specific boundary data (e.g. postal areas), it is only a matter of simple “copy and paste” to create thematic map with Sales Area Management Tool.

Example of thematic map created with Sales Area Management Tool 


In particular, you can create 4 different “territories”, each representing postcodes with attribute values belonging to a specific data range (e.g. quartiles of weekly family incomes). Just copy the list of postcodes for each data range from your spreadsheet to SAMT as comma separated values, then style the polygons in a given group, and it’s done! You have a thematic map that can be copied into your documents or printed for further perusals in a hardcopy format.

SAMT is a very handy tool for quick generation of thematic maps with public data like Census statistics, or with your own information derived from, for example, user surveys or sales statistics.

The above map is just an example to illustrate that even simple apps like SAMT can be used for a variety of tasks (i.e. can be "repurosed" in many creative ways). Low cost of such tools and ease of use means these apps offer a great value for money for the end user.


There are more advanced tools on MapDeck for creating thematic maps dynamically from large datasets.  We will describe them in detail in future posts.


Contact aus-emaps.com on info@aus-emaps.com to arrange a free trial of SAMT.

Related Posts:
Sales Area Management Tool 2015 Upgrade
Sales Area Management Tool makes tedious tasks easy - and fast!

Mapping territories for multi-category franchise 
15 complex tasks Sales Area Management Tool will make easy 

Psst! MapDeck has been launched

$
0
0
Our brand new spatial marketplace and collaboration platform is live and ready for business. You are invited to try it now – it costs nothing to sign up and there is lots of free content to play with! No special skills or expertise in GIS required.

MapDeck was created with a vision that it will be the go-to place for spatial information and simple-to-use, task-oriented tools to support research, planning and operational activities - be it business or investment related, environmental, community or policy focused.


By collecting the most useful spatial data in one place, and providing simple tools to interact with it, we make it easy for anybody to take advantage of location intelligence capabilities and to derive invaluable, personalised information for decision making.

Our aim is to support spatial capabilities that range from simple map creation and visualization of spatial information for situation awareness, to advanced data processing for situation analysis.

MapDeck motto:
Good information is an essential ingredient of success… Locate, Map, Act!
Mapdeck has been launched with just a basic set of tools and information. Product range will expand over time to meet a growing list of user requirements.

Our initial focus is on supporting franchise industry as well as marketing and sales related activities with applications like the Sales Area Management Tool or Thematic Mapper, and popular datasets like postcodes/zip codes and demographic statistics. But there is more to come.

MapDeck has been fully operational since late December 2015. January was very busy as we transitioned our current clients from legacy apps to the new platform. Now we are inviting members of the public to take advantage of MapDeck capabilities.  

Contact us for a unique access code to find out for yourself how you and your organisation can benefit - please email your request to info@aus-emaps.com.
Viewing all 123 articles
Browse latest View live


Latest Images